Proposed Night-time Flying Policy | Aircraft Night Noise Assessment Report | Maps | Night Noise Contours INM Assumptions | 1 Manston Airport night noise assessment review | 2 Review of Night Quota Schemes at other UK Airports | 3 GLOSSARY OF TERMS
September 2010 | Maps | Night Noise Contours INM Assumptions | 1 Manston Airport night noise assessment review | 2 Review of Night Quota Schemes at other UK Airports
THANET DISTRICT COUNCIL MANSTON AIRPORT NIGHT NOISE ASSESSMENT REVIEW 4222827/R01 November 2010

Issue/Revision
|
Issue 1
|
Issue 2
|
Issue 3
|
Remarks
|
Draft
|
Draft
|
Final
|
Date
|
19 October 2010
|
22 October 2010
|
4 November 2010
|
Submitted to
|
Penny Button
|
Penny Button
|
Penny Button
|
Prepared by
|
Ed Weston
|
Ed Weston
|
Ed Weston
|
Signature
|
|||
Approved by
|
Stephen Turner
|
Stephen Turner
|
Stephen Turner
|
Signature
|
|||
Project number
|
4222827
|
4222827
|
4222827
|
File reference
|
4222827-R01/elw1056
|
4222827-R01/elw1056
|
4222827-R01/elw1056
|
Disclaimer
This Report was completed by Bureau Veritas on the basis of a defined programme of work and terms and conditions agreed with the Client. Bureau Veritas confirms that in preparing this Report it has exercised all reasonable skill and care taking into account the project objectives, the agreed scope of works, prevailing site conditions and the degree of manpower and resources allocated to the project.
Bureau Veritas accepts no responsibility to any parties whatsoever, following the issue of the Report, for any matters arising outside the agreed scope of the works.
This Report is issued in confidence to the Client and Bureau Veritas has no responsibility to any third parties to whom this Report may be circulated, in part or in full, and any such parties rely on the contents of the report solely at their own risk.
Unless specifically assigned or transferred within the terms of the agreement, the consultant asserts and retains all Copyright, and other Intellectual Property Rights, in and over the Report and its contents.
Any questions or matters arising from this Report should be addressed in the first instance to the Project Manager.
Table of Contents Page no.:
|
||
1
|
Summary
|
1
|
2
|
Introduction
|
2
|
3
|
Night Noise
|
3
|
4
|
Review: Aircraft Night Noise Assessment Report
|
4
|
5
|
Review: Night Noise Contours INM Assumptions Report
|
15
|
6
|
Review: INM Model
|
18
|
7
|
Review: Manston Airport Proposed Night-time Flying Policy
|
23
|
8
|
Conclusions
|
25
|
1.0 Summary
1.0.1 On behalf of Thanet District Council (TDC), Bureau Veritas (BV) have undertaken a review the Night Noise Assessment prepared by Bickerdike Allen Partners (BAP) for Kent International (Manston) Airport (MSE). The Night-time Flying Policy which is based on some of the findings of the Night Noise Assessment has also been reviewed.
1.0.2 The Night Noise Assessment has shown that significant numbers of people living in the vicinity of Manston Airport (MSE) are likely to experience noise impact due to forecast operations in 2018.
1.0.3 The Night Noise Assessment suggests that these impacts could be mitigated by means of a quota count system to limit aircraft movements during the core (6.5 hour) night period, and a sound insulation scheme which could be offered to residents whose dwellings are exposed to 57 dB LAeq,8h or more.
1.0.4 Even with this in place, it is BVs view is that the predicted number of people likely to be exposed to significant levels of average night-time noise is not sufficiently justified by the number of passengers and freight activity that are forecast to benefit from the proposals. This is on the basis that the number of people likely to be impacted by night noise at MSE, normalised with respect to the annual passenger throughput, is greater than that at each of the designated London airports,
1.0.5 BV considers that there is a good case for seeking a lower annual quota limit than the 1995 proposed. Alternative lower limits have been proposed for consideration which would place MSE in line with the quota limits at other airports. At the designated London airports, the quota limit is accompanied by a movement limit and it would be good practice to include a movement limit in any quota count regime established at MSE. Introducing this measure and lowering the quota count limit would mean that the control system would take effect at a lower level of noise impact, thus limiting disturbance to a lower level.
1.0.6 In order to reduce noise impact on nearby residents due to individual aircraft movements, BV would recommend that bedrooms of dwellings predicted to be exposed to 90 dB(A) SEL or more are also included in the sound insulation scheme.
1.0.7 BV suggests an additional control to protect residents from noise impact during the whole night-time period, i.e. including the evening and morning shoulder-periods when the majority of night-flights are to occur. Imposing a suitable area limit for the 48 dB LAeq,8h night noise contour would be an appropriate means for controlling this.
1.0.8 It is BVs recommendation that the above points are considered for inclusion in the Night-time Flying Policy.
1.0.9 The conclusions on noise impact have been based upon computer noise modelling undertaken by BAP. BV has reviewed the input assumptions for this modelling and, using these, has undertaken their own independent noise modelling. The results of this have shown the contour modelling undertaken by BAP is accurate and representative of the input data provided.
2.0 Introduction
2.0.1 Bureau Veritas (BV) has been tasked by Thanet District Council (TDC) to review the Night Noise Assessment prepared by Bickerdike Allen Partners (BAP) on behalf of Kent International (Manston) Airport (MSE), and the resulting Night-time Flying Policy.
2.0.2 MSE is proposing to implement a night flying policy which is based on the night noise assessment. There is an obligation on TDC to have that assessment independently reviewed and verified. The scope of the brief involves both reviewing the noise assessment, but also commenting on the merits of the proposed policy that has been based on that assessment.
2.0.3 BV has reviewed the following relevant documents relating to noise:
3.0 Night Noise
3.0.1 Night noise has been recognised as being one of the major noise problems relating to airports for many years. This was particularly reflected in December 2003, in the Department for Transport (DfT) publication entitled the Future of Air Transport, known as the Air Transport White Paper (ATWP)1. In that it sets out a measured and balanced approach to providing a strategic framework for the development of air travel in the UK over the next 30 years.
3.0.2 Paragraph 3.13 of the ATWP2 states:
The Government recognises that noise from aircraft operations at night is widely regarded as the least acceptable aspect of aircraft operations. We will bear down on night noise accordingly, but we must strike a fair balance between local disturbance, the limits of social acceptability and the economic benefits of night flights. This should be done on a case-bycase basis.
3.0.3 At the main London airports, various night noise control regimes have existed for many years. Currently, these are based on the relative noise levels generated by different aircraft together with the number of movements. The current method is based on the Quota Count (QC) system, which assigns a QC value to individual aircraft depending on the noise they generate on departure and arrival. There are limits on the total quota and number of movements that can use the particular airport at night.
3.0.4 At the London airports, and elsewhere, noise infringement limits also exist for departures during the night-time. The noise limits are often lower than equivalent daytime limits, reflecting the greater sensitivity of noise at night, and the fines levied on the airlines for exceeding the limits are often higher than for daytime infringements.
3.0.5 Some airports also have night-time LAeq,8h noise contour area limits.
3.0.6 In connection with airports, night-time has attracted several definitions:
3.0.7 The Night Noise Guidelines for Europe were produced by the World Health Organisation (WHO) in 20095. This document aimed to present the conclusions of the WHO working group responsible for preparing guidelines for exposure to noise during sleep. The need for these health-based guidelines originated in part from the END which compels European Union Member States to produce noise maps and data about night exposure from mid-2007.
3.0.8 These guidelines use the 8 hour night-time period. There is therefore an increasing case for controlling noise during this period.
1
The Future of Air Transport White Paper Department for Transport (DfT). December 2003
2
It is recognized that the ATWP was published under the previous Government. At the time of writing there is no indication that
the current Coalition government views night noise any differently3
Planning Policy Guidance Note 24 (PPG24) 4
EU Directive 2002-49-EC Environmental Noise Directive (END) 5
World Health Organisation Night Noise Guidelines for Europe. 2009
4.0 Review: Aircraft Night Noise Assessment Report
4.0.1 The Night Noise Assessment produced by BAP provides an introduction, description of the airport site and surrounding areas, their assessment criteria, their noise contouring and assessment methodologies, and their impact assessment. Eleven accompanying figures have also been provided, as well as the noise modelling assumptions in an appendix. The appendix is reviewed in section 5 below of this BV report.
4.0.2 The reviews of these sections of the BAP report are presented below. Key issues are described and reference is made to the figures where necessary.
4.1 Description of the airport
4.1.1 MSE is located in the Isle of Thanet, about 3 km to the west of Ramsgate town (just over 1 km from the nearest residential area), about 4 km south of Westgate and about 5 km to the southwest of Margate. Lying between about 1 and 3 km from the airport are a number of small villages such as Woodchurch, Manston and Acol to the north, and Minster and Cliffs End to the south. The village of St Nicholas Wade is located about 6 km to the west of the airport.
4.1.2 The airport operates with a preference for departures to the west on runway 28 and arrivals from the west on runway 10 (when weather conditions permit such operations to occur in a safe manner) to minimise noise impact on the more densely populated areas to the east of the airport.
4.1.3 The noise abatement departure route requiring operators of jet and large aircraft to make a right turn to the northwest at a distance of around 1.5 miles from the centre of the airport runway, as long as operationally safe to do so, will minimise departure noise impact to residents of Herne Bay.
4.2 Need for additional night operations
4.2.1 The Introduction states that MSE is seeking to agree a policy with Thanet District Council to establish a regular schedule of flights into and out of the airport that will occur between the recognised night-time hours of 23:00 and 07:00h.
4.2.2 Given the sensitivity of night flights, and the comments in the ATWP, whilst MSE clearly desires night flights, there is an obligation to be sure that the economic benefits from those flights do justify the inevitable disturbance that will occur. This aspect is considered later in section 4.6.
4.3 Aircraft Movements and the Quota Count system
4.3.1 The Night Noise Policy is to be based on the Quota Count system, which prohibits certain noisy aircraft types from flying between 23:00 and 07:00h, and sets quota limits for operations between 23:30 and 06:00h. Versions of this system have been used at UK airports including Heathrow, Stansted, Gatwick, Manchester and Bristol. The details of the Quota Count system are given in the Noise Restriction Notice published by NATS6.
4.3.2 Choosing to use this tried and tested system for MSE is therefore appropriate, on the condition that a suitable quota limit is agreed. Having said that, this system only controls activity between 23.30 and 06.00 hours, which on its own would leave the shoulder periods uncontrolled (other than by the inherent runway capacity).
London Heathrow, London Gatwick and London Stansted Airports Noise Restrictions Notice 2009, ref S 8/2009, 26th February 2009.
4.3.3 Tables 5 and 6 of the Airport Master Plan provide information on the total annual and average daily forecast aircraft movements, including passenger, freight and other (namely general aviation). This is repeated below:
Figure 1: Forecast Annual and Daily Average Aircraft Movements in 2018
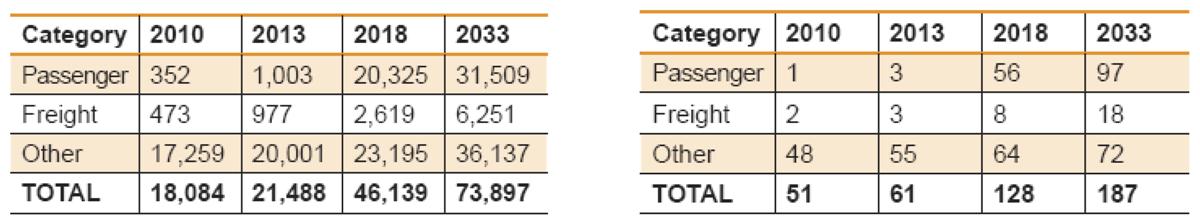
4.3.4 Section 3.2 of the BAP report presents the projected night-time movements for 2018. These have been reviewed by BV and are repeated below:
Table 1: Night-time Aircraft Movements in 2018
Annual
|
Typical night
|
||||
Hours
|
Passenger
|
Freight
|
Passenger
|
Freight
|
|
23.00-23.30
|
1016
|
157
|
2.8
|
0.4
|
|
23.30-06.00
|
610
|
471
|
1.7
|
1.3
|
|
06.00-07.00
|
407
|
157
|
1.1
|
0.4
|
|
Total
|
2033
|
785
|
5.6
|
2.1
|
|
4.3.5 Comparing these, we can see that the night-time (8 hour) operations would account for 6.1% of the total forecast movements in 2018. Compared with airports elsewhere this is about the average proportion. Night-time passenger and freight movements would account for 10% and 30% of the total movements within these respective categories.
4.3.6 Considering the 6.5 hour night quota count period, night operations would account for 2.3% of the total forecast movements (3% for passenger and 18% for freight categories separately). As would be expected, in terms of the total airport activity, there is a weighting towards freight movements at night.
4.3.7 The fleet mix of aircraft types proposed to operate during the 6.5 hour night quota count period is presented in Table 1 of the BAP INM Assumptions report. These have been repeated below along with the quota counts associated with the aircraft, and a calculation of what the annual quota count would be on the basis of the forecast. Note that as some aircraft types have a range of QCs depending on variant and take-off weight, calculations have been undertaken on the basis of all aircraft on their minimum, maximum and likely modal QC:
Table 2: Night-time Quota Count Analysis
A/C type
|
Annual mvts in QC period
|
Minimum QC
|
Maximum QC
|
Likely modal QC
|
|||||||||
Arrival
|
Departure
|
Arrival
|
Departure
|
Arrival
|
Departure
|
||||||||
A/C QC
|
Quota
|
A/C QC
|
Quota
|
A/C QC
|
Quota
|
A/C QC
|
Quota
|
A/C QC
|
Quota
|
A/C QC
|
Quota
|
||
A320
|
183
|
0.25
|
23
|
1
|
46
|
1
|
46
|
1
|
92
|
1
|
46
|
1
|
69
|
A340
|
30
|
0.5
|
8
|
1
|
15
|
1
|
15
|
4
|
60
|
1
|
8
|
2
|
30
|
738
|
183
|
0.5
|
46
|
1
|
46
|
1
|
46
|
1
|
92
|
1
|
46
|
1
|
69
|
752
|
61
|
0.25
|
8
|
1
|
15
|
1
|
31
|
1
|
31
|
1
|
15
|
1
|
31
|
DH8D
|
91
|
0.5
|
23
|
0
|
0
|
1
|
23
|
0
|
0
|
1
|
23
|
0
|
0
|
E195*
|
61
|
0.25
|
8
|
1
|
15
|
1
|
15
|
1
|
31
|
1
|
15
|
1
|
23
|
A300
|
24
|
1
|
12
|
2
|
24
|
2
|
24
|
2
|
24
|
1
|
6
|
2
|
24
|
A310
|
24
|
0.5
|
6
|
1
|
12
|
1
|
12
|
2
|
24
|
1
|
12
|
2
|
24
|
A330
|
24
|
0.5
|
6
|
1
|
12
|
1
|
6
|
2
|
24
|
1
|
6
|
2
|
24
|
744
|
141
|
1
|
71
|
2
|
141
|
2
|
141
|
4
|
282
|
2
|
141
|
4
|
282
|
748**
|
47
|
0.5
|
12
|
1
|
24
|
1
|
24
|
2
|
47
|
1
|
24
|
2
|
47
|
DC10
|
71
|
2
|
71
|
2
|
71
|
4
|
142
|
8
|
284
|
4
|
142
|
4
|
142
|
DC8
|
47
|
0.8
|
19
|
2
|
47
|
8
|
188
|
16
|
376
|
2
|
47
|
8
|
188
|
MD11
|
94
|
2
|
94
|
2
|
94
|
2
|
94
|
2
|
94
|
2
|
94
|
2
|
94
|
Sum
|
1081
|
404
|
562
|
806
|
1459
|
624
|
1046
|
||||||
Total Quota
|
966
|
2265
|
1669
|
||||||||||
* QC not listed, therefore set as for A320 ** QC not listed, therefore set as half the QC for 747-400 (in accordance with BAP movement assumption)
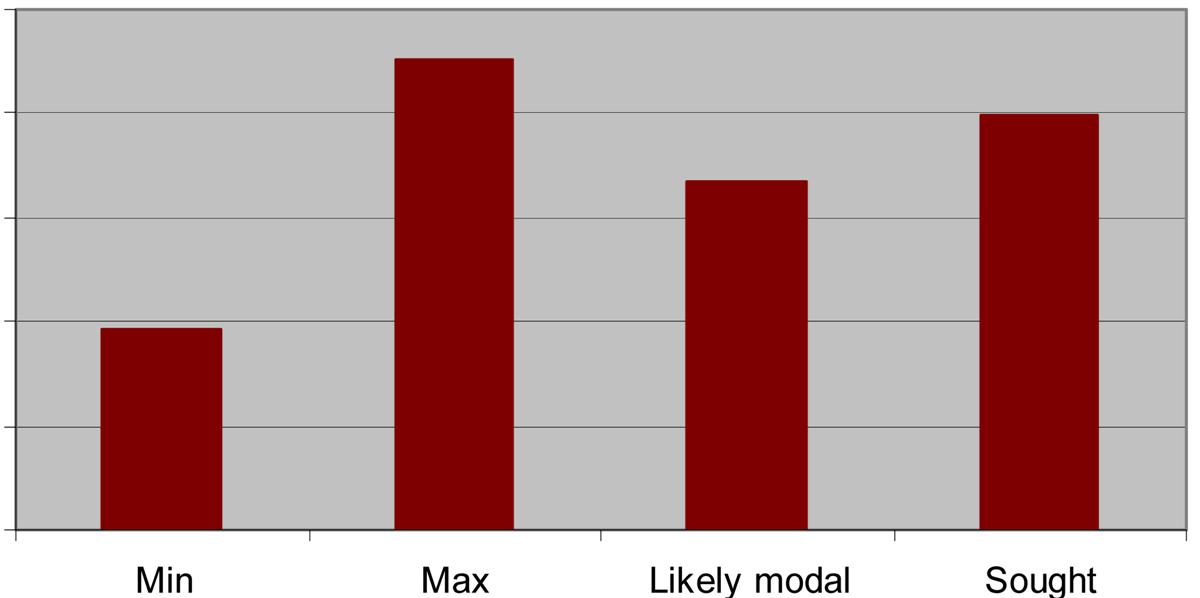
4.3.8 The QC system proposed for MSE seeks a quota count for the calendar year of 1995 for the Night-time Quota Count Period. Comparing this with the above analysis shows that the quota sought is towards the high end of the possible range (from 966 to 2265). This is illustrated in Figure 2 below:
Figure 2: Quota comparison
2500
2000
1500
1000
500
0
4.3.9 Table 1 above also supports the assertion made in section 3.2 of the BAP report that over 60% of night operations will take place during the shoulder periods, which as indicated above is not controlled by the quota system. BAP also mention that it is generally accepted that the most sensitive time for people at night is the quota count period, and particularly during the hours of 01:00 and 06:00. People are, however, also sensitive to noise when they are trying to get to sleep and soon before waking up in the morning, i.e. during the shoulder periods. Noise impact during the shoulder periods could be regulated by imposing a limit on the area of an LAeq,8h night-time noise contour, as suggested in section 4.6.19 below.
4.3.10 An indication of the severity of night noise controls is given by considering the average quota count per aircraft movement within the night quota period. The policy proposes an annual quota of 1995 created by 1081 movements, giving a quota count per aircraft movement of 1.85. The current regime at London Heathrow permits an annual quota of 9180 created by 6320 movements, giving a quota count per aircraft movement of 1.45. The corresponding figures for Gatwick and Stansted are 0.62 and 0.67 respectively.
4.3.11 It can be seen that for the anticipated number of night movements, the average quota count per aircraft movement at MSE is greater than at any of the three designated London airports. If the average quota count for Heathrow was applied, the annual quota limit would be just under 1570. If the equivalent for Stansted was applied, the annual quota limit would be about
725. It can be seen that 1570 (relating to Heathrow) fits within the range of likely total quota depending on the exact aircraft types used, but 725 (relating to Stansted) would be unlikely to permit the proposed number and mix of aircraft movements. This is due to the bias towards larger aircraft types proposed for MSE compared with the mix at Stansted. Therefore, there is a good case for seeking a lower annual quota limit to reduce the potential noise impact at night.
4.3.12 At the designated airports, the quota limit is accompanied by a movement limit. It would be good practice to include a movement limit in any quota count regime established at MSE.
4.3.13 The final paragraph of this section in the BAP report states that the LAeq night noise contours have been generated on the basis of the full 8-hour night. This is appropriate referring to the assessment criteria (below). Furthermore, as 60% of night movements occur during the (total)
1.5 hour shoulder period, the 8-hour contours present a far better representation of the night noise impact.
4.4 Night Noise Assessment Criteria
Criteria for average noise levels
4.4.1 Sleep disturbance relating to average night-time noise levels evaluated using the LAeq,8h noise contours is considered. On the basis of a detailed review of a number of sources, the nighttime criterion of 55 dB LAeq,8h has been selected. This is 7 dB higher than the 48 dB LAeq,8h which is based on the PPG24 boundaries.
4.4.2 Noise abatement objectives at Heathrow, Gatwick and Stansted restrict the Night Quota Period (6.5 hour) 48 dB(A) contour areas, and other airports including Manchester and London Luton regularly produce 48 dB LAeq,8h night noise contours to give an indication of their control of night noise disturbance. A precedent for using 48 dB(A) has therefore been set.
4.4.3 The BAP report provides some evidence to justify the view that higher noise levels are acceptable. I.e. at some UK airports, dwellings have been exposed to noise levels in excess of 60 dB LAeq,16h. It is assumed there is a typo here, and that LAeq,8h was intended. This includes Nottingham East Midlands Airport (NEMA) where over 200 dwellings were exposed to = 60 dB LAeq,8h in 2004. Another example for comparison would be Stansted. In 2006, fewer than 100 dwellings were exposed to = 60 dB LAeq,8h based on an annual average day7. As the assessment for MSE has also been based on an annual average day, this is a fair comparison,
4.4.4 A key source which has not been included in the review is the World Health Organisations (WHO) Night Noise Guidelines for Europe8. The WHO Regional Office for Europe developed the Night noise guidelines for Europe to provide expertise and scientific advice to the European Member States in developing future legislations in the area of night noise exposure control and surveillance, with the support of the European Commission. This guidelines document reviews the health effects of night time noise exposure, examines exposure-effects relations, and presents guideline values of night noise exposure to prevent harmful effects of
7
ERCD Report 0708, London Stansted Airport, Strategic Noise Maps 2006 8
World Health Organisation Night Noise Guidelines for Europe. 2009
night noise in Europe. Although these guidelines are neither standards nor legally binding criteria, they are designed to offer guidance in reducing the health impacts of night noise based on expert evaluation of scientific evidence in Europe.
4.4.5 Guidelines are given in terms of the Lnight,outside noise metric (Lnight is the same as LAeq,8h but is an annual average night rather than the more usual summer average night).
4.4.6 Quoting from the document, based on the systematic review of evidence produced by epidemiological and experimental studies, the relationship between night noise exposure and health effects can be summarised as below in Figure 3.
Figure 3: Effects of Different Levels of Night Noise on the Populations Health
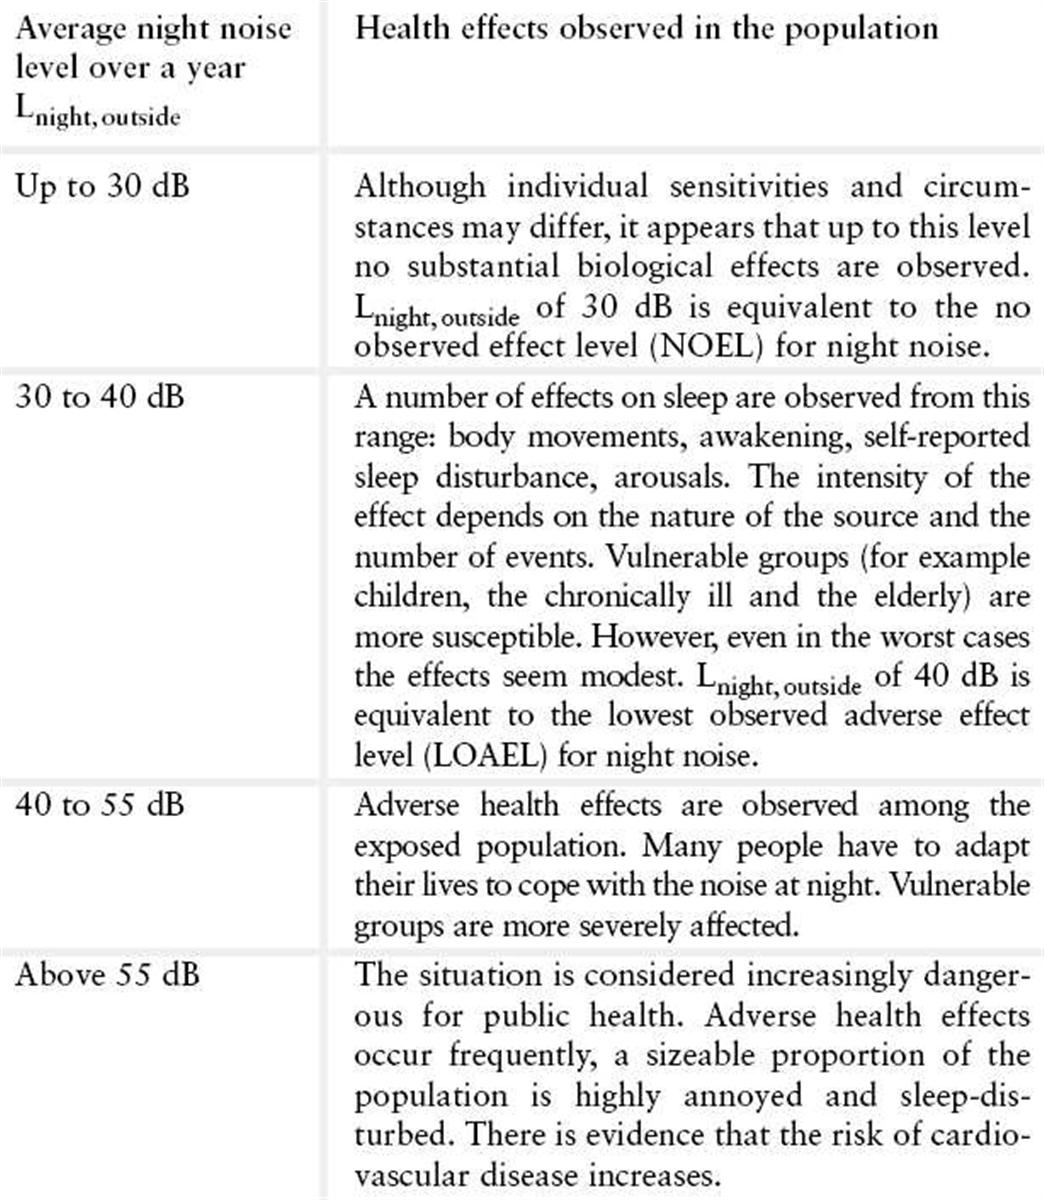
4.4.7 Below the level of 30 dB Lnight,outside, no effects on sleep are observed except for a slight increase in the frequency of body movements during sleep due to night noise. There is no sufficient evidence that the biological effects observed at the level below 40 dB Lnight,outside are harmful to health. However, adverse health effects are observed at the level above 40 dB Lnight,outside, such as self-reported sleep disturbance, environmental insomnia, and increased use of somnifacient drugs and sedatives.
4.4.8 Therefore, 40 dB Lnight,outside is equivalent to the lowest observed adverse effect level (LOAEL) for night noise. Above 55 dB the cardiovascular effects become the major public health concern, which are likely to be less dependent on the nature of the noise. Closer examination of the precise impact will be necessary in the range between 30 dB and 55 dB as much will depend on the detailed circumstances of each case.
4.4.9 Based on the exposure-effects relationship summarised in Figure 3, the following night noise guideline values for the protection of public health from night noise are recommended by the WHO:
4.4.10 These values are supported as follows: For the primary prevention of subclinical adverse health effects related to night noise in the population, it is recommended that the population should not be exposed to night noise levels greater than 40 dB of Lnight,outside during the part of the night when most people are in bed. The LOAEL of night noise, 40 dB Lnight,outside, can be considered a health-based limit value of the night noise guidelines (NNG) necessary to protect the public, including most of the vulnerable groups such as children, the chronically ill and the elderly, from the adverse health effects of night noise.
4.4.11 An interim target (IT) of 55 dB Lnight,outside is recommended in the situations where the achievement of NNG is not feasible in the short run for various reasons. It should be emphasized that IT is not a health-based limit value by itself. Vulnerable groups cannot be protected at this level. Therefore, IT should be considered only as a feasibility-based intermediate target which can be temporarily considered by policy-makers for exceptional local situations.
4.4.12 Given this analysis, using the 55 dB(A), LAeq,8h value is too high, and as used at other airports, there is a compelling case to use the 48 dB LAeq,8h as the night noise target, which lies between the NNG and IT levels and offers a good compromise between the two.
Criteria for noise from individual aircraft events
4.4.13 BAP has based their criteria for assessing noise from individual aircraft events again on a number of sources of information, including guidance in PPG24 as appropriate. They cite the Department of Transport research study9 on the effect of night noise which formed the basis of 90 dB(A) SEL being considered the threshold of significance for individual night-time aircraft events. They have, however, interpreted the observation that 90 dB(A) SEL causes an average person a 1/75 chance of being wakened as:
4.4.14 Consequently, Table 3 of the BAP report indicates no significant risk if there are no more than 13 events producing noise at a level of 90 dB(A) SEL, and a slight risk if there are no more than six events producing noise at a level of 95 dB(A) SEL.
4.4.15 It was subsequently established (at the Heathrow Terminal 5 Inquiry) that this research result did not take account of the effect of:
4.4.16 Another source is the work undertaken by Griefahn and Scheuck10. An analysis is presented by BAP which takes account of the sound reduction that may be expected from outside to inside through a closed single glazed window, which amounts to 27 dB(A) as established in PPG24. In this section, there are believed to be a number of typos. Firstly, the number of
9
Report of a Field Study of Aircraft Noise and Sleep Disturbance. Department of Transport, Dec 1992, Ollerhead J B et al
(1992).10
Scheuch K, Griefahn B, Jansen G, Spreng M (2003). Evaluation criteria for aircraft noise. Rev Environ Health, Jul-Sep 2003, 18(3), 185-201.
events at certain noise levels should refer to outdoor conditions (rather than indoor). Secondly, the Threshold Value item should read 23 events @ 67 dB LAmax outdoors (approximately 75 dB(A) SEL). This is considerably lower than the 77 dB LAmax outdoors and 85 dB(A) SEL quoted.
4.4.17 Two key sources of information relating to individual events have not been mentioned. British Standard BS823311 draws on the results of research and experience to provide information on the design of buildings that have internal acoustic environments appropriate to their functions. It deals with control of noise from outside the building, amongst other things. It advises that the indoor LAmax at night should not to exceed 45 dB(A). Again considering an attenuation of 27 dB(A) through a closed window, this would mean an outdoor LAmax limit of 72 dB (broadly equivalent to an SEL of 80 dB(A)).
4.4.18 The second source is again the WHO Night Noise Guidelines for Europe. It notes that short-term health effects are mainly related to maximum levels per event inside a bedroom, i.e. LAmax,inside. A number of instantaneous effects are connected to threshold levels expressed in LAmax (see Figure 4 below) however the health relevance cannot be easily established. The report states, however, that it can be safely assumed that an increase in the number of such events over the baseline may constitute a subclinical adverse health effect by itself leading to significant clinical health outcomes.
Figure 4: Summary of effects and threshold levels for effects where sufficient evidence is available
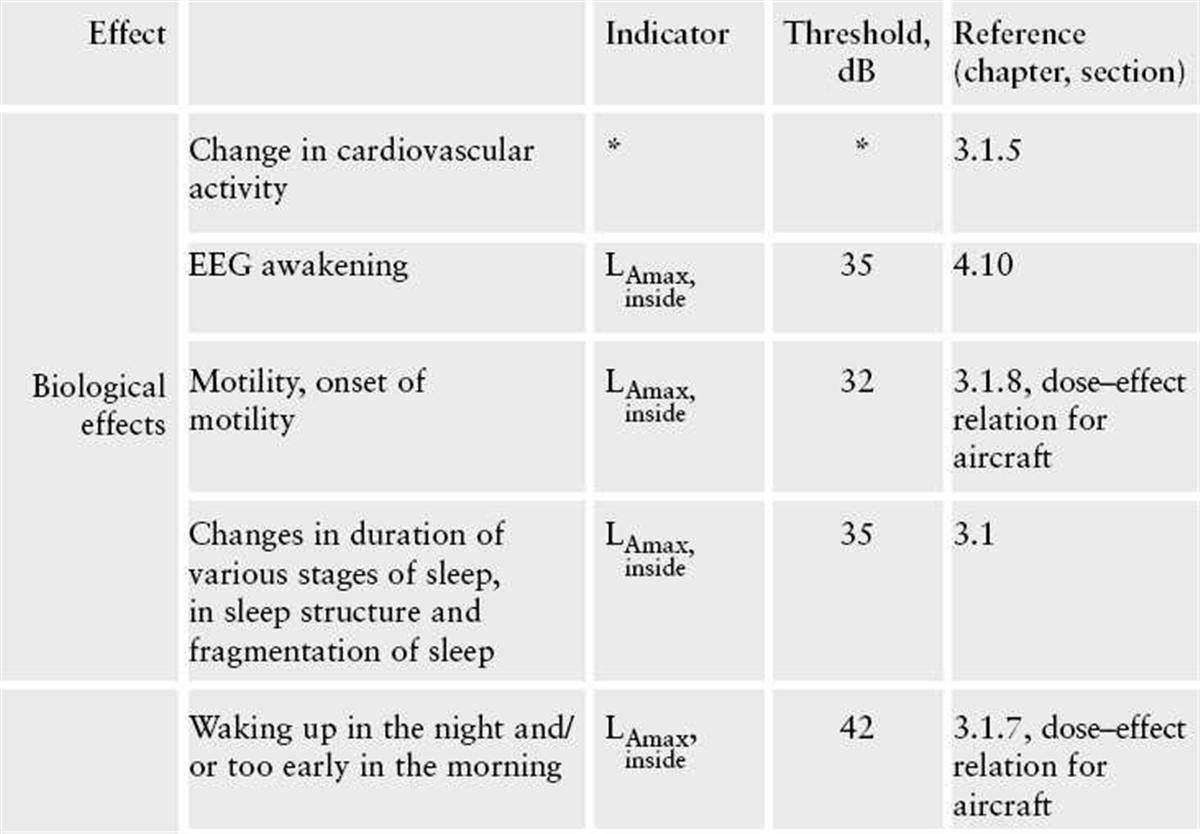
4.4.19 As the figure shows, indoor LAmax threshold values are actually lower than the guidance given in BS8233.
4.4.20 Table 3 of the BAP report summarises the night noise criteria. BV would suggest that standard practice is adopted, i.e. that the 48 dB LAeq,8h is used to assess the number of dwellings/people affected by average noise over the 8-hour night-time period, and that >55 dB LAeq,8h would lead to a risk of more than just some sleep disturbance.
4.4.21 Bearing in mind that the LAmax assessment is based on closed windows, BV would also suggest that 80 dB(A) SEL is considered the threshold of acceptability for individual aircraft events at night in line with current standard practice.
11
BS8233:1999 Sound insulation and noise reduction for buildings -Code of practice
4.5 Noise Contour and Assessment Methodology
4.5.1 The methodology used for producing the noise contours and the assessment methodology is presented in detail in the BAP INM Assessment report. This is reviewed in detail in section 5 below.
4.6 Impact of Night-time Airborne Aircraft Noise
8-hour LAeq night-time noise contours
4.6.1 The impact assessment begins by reviewing current night operations. It is stated that no dwellings are located within the 48 dB LAeq,8h night noise contour due to airport activity in 2009. This suggests no significant impact relating to average noise levels during the nighttime period (i.e. without considering individual noise events).
4.6.2 This contour is reported to occupy an area of less than 1.0 km2. The text states that the contours for 2009 are presented in Figure 2.1, but this has not been made available. It would be useful to see this contour to enable a visual comparison to be made between the current and future noise impacts.
4.6.3 The predicted night-time LAeq,8h noise contours relating to future night operations in 2018 are presented in BAP Figure 2. Table 4 in the BAP report shows the numbers of dwellings enclosed by these contours 48 to 72 dB(A) in steps of 3 dB. These show that 6386 dwellings may be exposed to 48 dB LAeq,8h or more, which is a significant number. Additionally, 318 dwellings would be eligible for sound insulation treatment following BAPs recommendation to treat properties exposed to 57 dB LAeq,8h. If all habitable rooms are treated under the scheme, it would also offer a benefit to residents during the daytime.
4.6.4 The CACI database also includes population data from which the number of people exposed to the various noise levels has been provided in the BAP INM Assessment report. These show that 13443 people are likely to be exposed to noise levels of 48 dB LAeq,8h or more in 2018.
4.6.5 The report states that around 800 dwellings will lie inside the 55 dB(A) contour which is proposed by BAP in their Table 3 to be the threshold of risk of some sleep disturbance. Section 6.2 of the BAP report does suggest that it will give rise to a slight risk of sleep disturbance which is not quite consistent with the nomenclature given in their Table 3. It would also be appropriate for the calculated population and dwelling data relating to this contour band to be presented in the INM Assumptions report.
4.6.6 For comparative purposes the numbers of dwellings exposed to a level of 55 dB LAeq,8h around NEMA, Stansted, Gatwick and Heathrow Airports have been presented. BV notes that the data used in these examples are drawn from 2003 and 2004 and is rather old. More up-todate information is available in the draft Airport Noise Action Plans, submitted to Defra to ultimately meet the requirements of the END.
4.6.7 Data on the number of dwellings and population exposed to noise are presented below for 2006 for the above airports, and compared with MSE in 2018. Note that this data is not publicly available for the 55 dB LAeq,8h, so the closest value has been chosen, i.e. 54 dB
LAeq,8h.
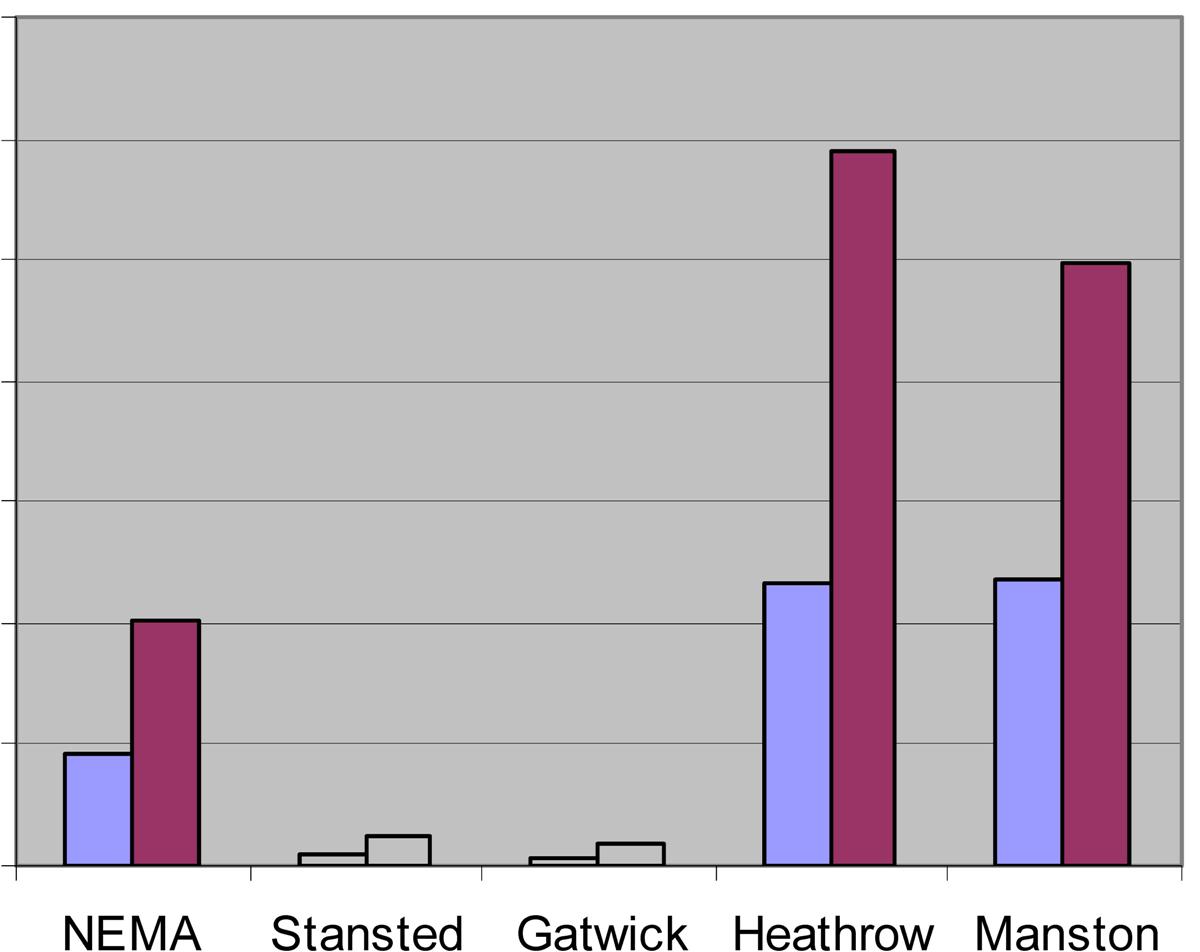
4.6.8 We have also normalised these against the annual passenger throughput so that comparisons of disbenefit (i.e. number of dwellings exposed) can be made between the airports on more equal terms (a more equitable analysis would be to normalise the dwelling and population data with night-time passenger/freight throughput, but this data is not available). The results of this have also been presented graphically in Figure 5.
Table 3: 54 dB LAeq,8h Night-time Noise Exposure Analysis
Airport
|
Year
|
Exposed
|
Passengers
|
Dwellings/ PAX
|
Pop/ PAX
|
|
Dwellings
|
Population
|
(mppa)
|
||||
Nottingham East Midlands Airport
|
2006
|
950
|
2100
|
5.20
|
183
|
404
|
Stansted
|
2006
|
450
|
1200
|
23.68
|
19
|
51
|
Gatwick
|
2006
|
450
|
1100
|
32.00
|
14
|
34
|
Heathrow
|
2006
|
31250
|
79500
|
67.34
|
464
|
1181
|
Manston
|
2018
|
1088
|
2272
|
2.29
|
475
|
992
|
Figure 5: Night-time Noise Exposure Analysis dwellings and population within the 54 dB LAeq,8h contour, per million passengers
1400
1200
1000
800
600
400
200
0
4.6.9 This analysis shows significant variation between airports. Heathrow clearly causes the greatest normalised disbenefit owing to the fact that it is located close to the highly populated areas of west London, despite the fact that it caters for twice the number of passengers of the next busiest airport, Gatwick, which affects comparatively few people hence the low normalised disbenefit. Stansted is a similar example to Gatwick. The normalised disbenefit for regional airports such as NEMA is somewhere in the middle as the low passenger throughput pushes up the normalised disbenefit despite the comparatively few people exposed to noise. On the basis of the forecasts, however, MSE is showing a greater normalised disbenefit to that of Heathrow in terms of dwellings exposed to 54 dB LAeq,8h. In fact, the predicted number of people exposed to this level of noise at MSE is over double the number that were exposed to noise at Stansted and at Gatwick airports which cater for 10-15 times the number of passengers.
4.6.10 This is a slightly unfair analysis as it is relating night noise impact against total passenger throughput. It would be helpful to have an idea of the likely night time passenger throughput (and freight movement) during the night for MSE and other airports so the relative impact of the night activity can be estimated.
SEL footprints
4.6.11 Like Leq contours, SEL footprints are lines of constant noise level on the ground. However, they represent noise levels for one single aircraft movement, rather than the aggregation of noise from an average day's (or night's) traffic. SEL footprints are expressed in terms of sound exposure level (SEL)12, rather than Leq.
4.6.12 85, 90 and 95 dB(A) SEL footprints are presented in BAP Figures 3.1 to 5.2. These have been calculated for the Boeing 737-800, 747-400 and the MD11 and relate mainly to westerly operations on runway 28 (easterly SEL footprints are presented only for the Boeing 747-400). The justification for this is that a greater number of dwellings/people are exposed to 95 dB(A) SEL during westerly departures and arrivals than easterly operations. BAP have asserted that 95 dB(A) SEL indicates a slight risk of sleep disturbance provided there are fewer than (or equal to) six events per night.
4.6.13 BV considers that 80 dB(A) SEL is a more appropriate threshold of significance. On this basis, Table 7 of the BAP INM Assessment report indicates that departures to the east on runway 10 will affect the greatest number of people, i.e. those living in the densely populated areas of Ramsgate. 80 dB(A) SEL contours have not been calculated but the populations predicted to be within the 85 dB(A) contour by such departures ranges from 14722 for MD11 departures, up to 30903 for the Boeing 747-400. This is a significant number of people.
4.6.14 The report recommends that given the small number of night-time aircraft events, it would be inappropriate to control aircraft noise by way of the SEL unit. BV would suggest that having no control over individual aircraft noise events at night could potentially leave a small number of dwellings exposed to in excess of 95 dB(A) SEL unprotected. Additionally, a large number of properties in the west of Ramsgate are also enclosed by the 90 dB(A) SEL contour but lie outside the proposed 57 dB LAeq,8h sound insulation eligibility contour, and may suffer significant disturbance.
4.6.15 London Heathrow Airport sets a benchmark which BV would suggest is adopted for MSE. It operates a domestic noise insulation scheme to address the impacts of night flights on local communities. It is designed to protect residents who are regularly exposed to noise from night flights.
4.6.16 It is based on the 90 dB(A) SEL noise footprint of the noisiest aircraft that operates in the night quota period (23:30 -06:00h). Rooms eligible for insulation are bedrooms or bed-sitting rooms only (which are used as bedrooms on most days of the year). The scheme provides noise insulation for all bedrooms or bed-sitting areas in approx 41,000 homes around Heathrow.
4.6.17 Those local residents who benefit from the sound insulation may still be disturbed, however, if they wish to open windows during the summer months. Opening windows renders any sound insulation treatment (to glazing) ineffective.
4.6.18 The report states that with a suitable sound insulation scheme in place, together with a suitable night noise quota count limit, the proposed night-time activities in 2018 at MSE are not expected to have any significant noise impact on the local community. BV considers that the proposed quota count limit of 1995 is too high to offer adequate protection. An annual limit based on an average quota count per movement that is closer to those at other airports may be more appropriate.
4.6.19 The quota count scheme puts a limit on noise impact during the 6.5-hour core night for local residents, but this leaves the evening and morning shoulder periods un-restricted. Owing to the fact that two-thirds of night operations are proposed during these periods, BV considers it appropriate to impose a limit on the area of the 48 dB LAeq,8h night-time noise contour.
4.6.20 Such a limit should be chosen carefully to strike a suitable balance between the needs of the airport to expand, and the rights of local residents not to be unduly impacted by noise from
12
Sound Exposure Level (sometimes called the Single Event Level) is a measure of the total sound energy associated with a single noise event (such as an aircraft over-flight). The SEL value represents the total amount of acoustic energy that occurred during the actual noise event under consideration, but as if it had all occurred in a one second period..
the aircraft. This limit should be agreed by the local authority and included in the Night-time Flying Policy.
4.6.21 Even with this in place, it is BVs view is that the predicted number of people likely to be exposed to significant levels of average night-time noise is not sufficiently justified by the number of passengers that are forecast to benefit from the proposals.
5.0 Review: Night Noise Contours INM Assumptions Report
5.0.1 This report sets out the assumptions used in the computation of the night-time airborne aircraft noise contours upon which the Night Noise Assessment reviewed in section 4 was based.
5.1 The Airport
5.1.1 The information given in section 2.0 of the report is accurate taking information from the relevant pages of the UK Air Pilot (EGMH AD 2.12 Manston).
5.2 Aircraft operations
5.2.1 Annual aircraft movement data has been supplied to BAP from the Airport. This data has been provided in Table 1 of the INM Assumptions report. BV has reviewed how BAP has compiled this data, using their previous experience and clarifications from the airport, into a form suitable for analysis.
5.3 Flight tracks
5.3.1 Section 3.3 of the BAP report refers to SIDs and STARs. These are Standard Instrument Departure (routes) and Standard Instrument Arrival (routes). Indeed, no such routes are available in the UK Aeronautical Information Package (AIP) which is the usual source of this information. There is not a formal requirement for an airport to have designated SIDs and STARs, but it is considered good practice, particularly for larger airports.
5.3.2 Appropriately, departure and arrival routes for the noise model have instead been generated based on information provided by the Airport and confirmed through consultation with Air Traffic Control.
5.3.3 Details of the routes include that arrivals follow the extended centre line of the runways for compatibility with the Airports Instrumented Landing System (ILS), and the right turn on westerly departures to avoid the built-up areas of Herne Bay. Training circuits have also been included in the model.
5.3.4 The BAP report states that a preliminary analysis showed that the SEL contours do not extend as far as the points on the departure routes provided by the Airport where aircraft become directed by Air Traffic Control (ATC). The 85 dB(A) SEL figures for the Boeing 747400 (Figures 4.1-4.4 in the BAP Noise Assessment report) do appear to extend slightly beyond 4 DME for departures on runway 10, but as this is over the Thames Estuary, we confirm this aspect of the modelling is appropriate.
5.3.5 One slight concern relates to Figure 1 of the BAP Noise Assessment report which shows the tracks to lie around 100 m to the north of the runway position; they should lie on the runway. This may be a graphical alignment issue in the preparation of the figure, but if a similar misalignment with respect to the contour figures and CACI population database prevails, the population assessment in section 6 of the BAP Noise Assessment report may not be accurate.
5.3.6 Confirmation should therefore be sought over whether the misalignment of the tracks in Figure 1 has affected the analysis.
5.4 Dispersion
5.4.1 To account for the dispersion of the actual tracks flown by departing aircraft about the departure route, BAP have used their standard dispersion model which has been determined from data collected at other similar airports. BV considers this model to be appropriate.
5.5 Flight profiles
5.5.1 The flight profiles modelled by BAP are dependent upon the take-off weight of an aircraft. This is dependent upon fuel load and the number of passengers (or freight load). As the number of passengers or freight load may vary significantly from flight to flight, the standard approach is to base departure profiles on fuel load. This is in turn dependent on the distance to destination, and it is on this basis that the stage length has been assigned to the various aircraft types. BV considers this approach to be appropriate.
5.5.2 A 3.0°approach angle is used for all aircraf t. This is standard practice for arriving aircraft at the majority of airports worldwide.
5.6 Traffic distribution by route
5.6.1 BAP has used the runway utilisation observed at MSE in 2009 to set the runway split for the model for 2018. This assumes 33% easterly operations on runway 10, and 67% westerly operations on runway 28.
5.6.2 Although a reasonable split given the prevailing wind direction in the UK, this does not appear to consider the preference for routing operations to the west of the airport (i.e. a preference for arrivals on runway 10 as well as departures on runway 28). This preference is described in qualitative terms in the proposed Night-time Flying Policy document, and could reduce noise impact on local residents. Adopting a runway split of 67% westerly is therefore considered appropriate for the purpose of noise modelling.
5.7 INM model
5.7.1 Noise contour predictions were made using version 7.0b of the Federal Aviation Administration (FAA) Integrated Noise Model (INM) prediction software. This is the most recent version of one of two software packages that are widely accepted and used in the acoustics profession for predicting airborne aircraft noise. The other is the ANCON model which is used by, amongst others, the Civil Aviation Authority for generating contours for BAA airports. There are accepted differences between the two packages, but both are generally considered to be sufficiently accurate.
5.8 INM model assumptions
5.8.1 The ground topography used is assumed to be flat. This is an acceptable assumption given the limited topography in the vicinity of the airport. It may, in fact, be a conservative assumption as the Noise Assessment Report states that the western edge of Ramsgate Town lies at a lower ground level than the runway and ground levels continue to fall towards the sea. Noise levels in these areas may therefore be lower than predicted. BAP have estimated that this would reduce the noise levels incident on properties beneath the flight path in this zone by around 0.5 to 1 dB as compared to predicted noise levels.
5.8.2 The default headwind of 14.8 km/h and all-soft ground lateral attenuation assumptions are appropriate.
5.8.3 Through many previous similar studies, BAP have undertaken validation exercises and refined the model input assumptions for certain aircraft types to better reflect actual aircraft operation and resulting noise levels. The modified aircraft types are either:
5.8.4 The approach taken by BAP is to adjust the movement numbers and aircraft type, which BV considers to be entirely reasonable and justifiable.
5.8.5 Table 5 in the BAP report lists the modelling input data. This level of disclosure is welcomed as it facilitates verification of the modelling and analysis of the resulting noise contours.
5.9 Contour areas and population counts
5.9.1 The 2009 and 2018 night noise contours have been produced on the basis of annual aircraft movement data. Contours are often produced for movements relating to the 92-day summer period (from 16th June to 15th September inclusive) which is considered to reflect the busiest months and therefore present a worst-case in terms of noise emission. Producing contours based on annual data is, nevertheless, a valid approach so long as this is born in mind when carrying out the assessment.
5.9.2 The population and dwelling counts have been determined using 2009 Census data by postcode location provided by CACI Ltd. This is a standard source of data, and the 2009 Census is understood to have been the most up-to-date version at the time of writing.
5.9.3 This CACI database does have some limitations. Listing data by postcode can mean that large population/dwelling numbers spread over an area can be attributed to a single geographical location. Some postcode locations may fall near to a contour line, so the resulting counts could be significantly affected by only a small change in the position of the contour line.
5.9.4 The CACI database is, however, widely used and understood to provide reasonable indications of population and dwelling counts enclosed by noise contours, amongst other things.
5.10 Summary
5.10.1 The aircraft noise modelling undertaken by BAP has been reviewed by BV and found to be acceptable. Clarification should, however, be sought on whether the misalignment of the tracks in Figure 1 has affected the presentation of the contour plots and the analysis of dwelling and population count data.
6.0 Review: INM Model
6.0.1 BV has produced night noise contours using the same modelling software as that used by BAP. The model has been built from scratch using the assumptions presented by BAP in their document titled 'Manston Airport Night Noise Contours INM Assumptions' (ref. A9293-R01-AH 28/09/10).
6.0.2 The review of the noise predictions will be on the basis of how closely the contour lines produced by BAP's modelling, and the resulting enclosed areas, are to those modelled by BV.
6.1 Input data
6.1.1 The validity of the input assumptions has been reviewed in section 5 above, all assumptions have been found to be appropriate. The input data used is taken from the BAP INM Assumptions report and is summarised below:
6.1.2 General aspects relating to the INM study
6.1.3 Airport
6.1.4 Flight tracks
6.1.5 Runway utilisation (split)
33% easterly (runway 10), 67% westerly (runway 28)
6.1.6 Dispersion
Table 4: Route dispersion
Distance along track from SOR (km)
|
Outer sub-track displacement (m)
|
Outer sub-track displacement (nm)
|
2.752 (end of runway)
|
0
|
0.0000
|
3.5
|
105
|
0.0567
|
4.0
|
211
|
0.1139
|
4.5
|
323
|
0.1744
|
5.0
|
434
|
0.2343
|
5.5
|
556
|
0.3002
|
6.0
|
678
|
0.3661
|
6.5
|
792
|
0.4276
|
7.0
|
905
|
0.4887
|
7.5
|
1007
|
0.5437
|
8.0
|
1109
|
0.5988
|
8.5
|
1184
|
0.6393
|
9.0
|
1260
|
0.6803
|
9.5
|
1324
|
0.7149
|
10.0
|
1387
|
0.7489
|
10.5
|
1444
|
0.7797
|
11.0 and above
|
1500
|
0.8099
|
6.1.7 Aircraft movements the following aircraft movements were calculated by BV from the annual movement data for 2018 as provided by the airport (Table 1 of BAP INM Assumptions report). These were used in the model to generate the 2018 noise contours.
Table 5: Aircraft movement data
INM Aircraft type
|
Runway/ operation
|
Stage length
|
Daily movements
|
Equivalent Annual movements
|
744
|
10DEP
|
1
|
0.1241
|
45
|
10ARR
|
1
|
0.1241
|
45
|
|
28DEP
|
1
|
0.2519
|
92
|
|
28ARR
|
1
|
0.2519
|
92
|
|
737800
|
10DEP
|
2
|
0.2758
|
101
|
10ARR
|
2
|
0.2758
|
101
|
|
28DEP
|
2
|
0.5599
|
204
|
|
28ARR
|
2
|
0.5599
|
204
|
|
757RR
|
10DEP
|
5
|
0.0922
|
34
|
10ARR
|
5
|
0.0922
|
34
|
|
28DEP
|
5
|
0.1872
|
68
|
|
28ARR
|
5
|
0.1872
|
68
|
A300B4-203
|
10DEP
|
1
|
0.0181
|
7
|
10ARR
|
1
|
0.0181
|
7
|
|
28DEP
|
1
|
0.0367
|
13
|
|
28ARR
|
1
|
0.0367
|
13
|
|
A310-304
|
10DEP
|
1
|
0.0181
|
7
|
10ARR
|
1
|
0.0181
|
7
|
|
28DEP
|
1
|
0.0367
|
13
|
|
28ARR
|
1
|
0.0367
|
13
|
|
A319-131
|
10DEP
|
2
|
0.1844
|
67
|
10ARR
|
2
|
0.1844
|
67
|
|
28DEP
|
2
|
0.3745
|
137
|
|
28ARR
|
2
|
0.3745
|
137
|
|
A320-211
|
10DEP
|
2
|
0.2758
|
101
|
10ARR
|
2
|
0.2758
|
101
|
|
28DEP
|
2
|
0.5599
|
204
|
|
28ARR
|
2
|
0.5599
|
204
|
|
A330
|
10DEP
|
1
|
0.0181
|
7
|
10ARR
|
1
|
0.0181
|
7
|
|
28DEP
|
1
|
0.0367
|
13
|
|
28ARR
|
1
|
0.0367
|
13
|
|
A340-211
|
10DEP
|
6
|
0.0457
|
17
|
10ARR
|
6
|
0.0457
|
17
|
|
28DEP
|
6
|
0.0927
|
34
|
|
28ARR
|
6
|
0.0927
|
34
|
|
DC1010
|
10DEP
|
1
|
0.0538
|
20
|
10ARR
|
1
|
0.0538
|
20
|
|
28DEP
|
1
|
0.1092
|
40
|
|
28ARR
|
1
|
0.1092
|
40
|
|
DC860
|
10DEP
|
1
|
0.0357
|
13
|
10ARR
|
1
|
0.0357
|
13
|
|
28DEP
|
1
|
0.0725
|
26
|
|
28ARR
|
1
|
0.0725
|
26
|
|
DHC6
|
10DEP
|
1
|
0.1374
|
50
|
10ARR
|
1
|
0
|
0
|
|
28DEP
|
1
|
0.2790
|
102
|
|
28ARR
|
1
|
0
|
0
|
|
MD11GE
|
10DEP
|
1
|
0.0705
|
26
|
10ARR
|
1
|
0.0705
|
26
|
|
28DEP
|
1
|
0.1432
|
52
|
|
28ARR
|
1
|
0.1432
|
52
|
|
SD330
|
10DEP
|
1
|
0
|
0
|
10ARR
|
1
|
0.1787
|
65
|
|
28DEP
|
1
|
0
|
0
|
|
28ARR
|
1
|
0.3627
|
132
|
6.1.8 Note that there are a few minor differences between this input data and that presented in Table 5 of the INM Assumptions report. However, these differences generally appear to be due to rounding and all are sufficiently small to have no significant effect on the resulting noise contours.
6.1.9 Model run options
6.2 Output: 8-hour night-time noise contour
6.2.1 The contours have been calculated at levels from 47 to 73 dB in steps of 1 dB. Without having access to the digital mapping used by BAP to present their contours (Figure 2 of their Aircraft Night Noise Assessment Report), BV has not been able to prepare a formal comparative figure.
6.2.2 The BV contours have, however, been superimposed manually onto the BAP figure for comparative purposes. This shows that the contours modelled by BAP are very close to the contours modelled by BV. Owing to the inherent accuracy of the modelling, it is customary to consider that the contours are accurate if they are within ±1 dB of the reference set. This is the case with the BAP contours.
6.2.3 In addition, the contour areas have been calculated and presented, again in 1 dB steps, in Table 6 below. Here, the results are compared with the contour areas calculated by BAP.
Table 6: 8-hour night-time contour area comparison
Contour level
|
Contour area, (km2)
|
|
BV
|
BAP
|
|
47
|
17.3
|
|
48
|
14.5
|
14.4
|
49
|
12.1
|
|
50
|
10.2
|
|
51
|
8.5
|
8.5
|
52
|
7.1
|
|
53
|
5.9
|
|
54
|
4.9
|
4.9
|
55
|
4.1
|
|
56
|
3.4
|
|
57
|
2.8
|
2.8
|
58
|
2.3
|
|
59
|
2.0
|
|
60
|
1.7
|
1.6
|
61
|
1.4
|
|
62
|
1.2
|
|
63
|
1.0
|
1.0
|
64
|
0.9
|
|
65
|
0.8
|
|
66
|
0.7
|
0.7
|
67
|
0.6
|
|
68
|
0.5
|
|
69
|
0.4
|
0.4
|
70
|
0.4
|
|
71
|
0.3
|
|
72
|
0.3
|
0.3
|
73
|
0.2
|
|
6.2.4 It can be seen that the areas enclosed by each of the contours calculated by BAP are within the areas calculated for the adjacent contour values. For example, the area predicted by BAP for the 48 dB LAeq,8h contour is less than that for the 47 dB contour, and greater than that for the 49 dB contour. In many cases, the predicted areas are the same. This further shows that the BAP contours are accurate.
6.3 Output: SEL noise footprints
6.3.1 In addition to the 8-hour night-noise contours, SEL noise footprint contours have also been calculated by BV and compared with the predictions made by BAP in the same way as for the 8-hour night-time LAeq contours. A comparison of the contour areas is presented below for the scenarios illustrated in BAP figures 3.1 to 5.2.
Table 7: SEL footprint noise contour areas (km2)
Contour level, dB(A)
|
738-28A
|
738-28D
|
MD11-28A
|
MD11-28D
|
||||
BV
|
BAP
|
BV
|
BAP
|
BV
|
BAP
|
BV
|
BAP
|
|
84
|
6.2
|
13.9
|
7.5
|
13.2
|
||||
85
|
4.9
|
4.9
|
11.6
|
11.6
|
6.2
|
6.2
|
11.2
|
11.2
|
86
|
3.9
|
9.8
|
5.0
|
9.5
|
||||
89
|
1.9
|
6.4
|
2.6
|
6.1
|
||||
90
|
1.5
|
1.5
|
5.4
|
5.4
|
1.8
|
1.8
|
5.4
|
5.4
|
91
|
1.2
|
4.5
|
1.4
|
4.8
|
||||
94
|
0.6
|
2.5
|
0.8
|
3.1
|
||||
95
|
0.5
|
0.5
|
2.0
|
2.0
|
0.6
|
0.6
|
2.5
|
2.5
|
96
|
0.4
|
1.6
|
0.5
|
2.0
|
||||
Contour level, dB(A)
|
744-28A
|
744-28D
|
744-10A
|
744-10D
|
||||
BV
|
BAP
|
BV
|
BAP
|
BV
|
BAP
|
BV
|
BAP
|
|
84
|
17.6
|
25.0
|
17.6
|
25.0
|
||||
85
|
14.6
|
14.6
|
20.5
|
20.5
|
14.6
|
14.6
|
20.5
|
20.5
|
86
|
11.9
|
16.9
|
11.9
|
16.9
|
||||
89
|
6.5
|
9.7
|
6.5
|
9.7
|
||||
90
|
5.3
|
5.3
|
8.1
|
8.1
|
5.3
|
5.3
|
8.0
|
8.0
|
91
|
4.3
|
6.7
|
4.3
|
6.7
|
||||
94
|
2.3
|
3.8
|
2.3
|
3.8
|
||||
95
|
1.9
|
1.9
|
3.1
|
3.1
|
1.9
|
1.9
|
3.1
|
3.1
|
96
|
1.6
|
2.6
|
1.6
|
2.6
|
||||
6.3.2 For the scenarios calculated, the areas enclosed by the 85, 90 and 95 dB(A), as predicted by BAP, match the BV predictions exactly (to 1 decimal place).
6.4 Summary of noise modelling
6.4.1 On the basis of the above analysis, BV concludes that the contour modelling undertaken by BAP is accurate and representative of the input data provided.
7.0 Review: Manston Airport Proposed Night-time Flying Policy
7.0.1 The Proposed Night-time Flying Policy document begins with sections on Background, the Airports Master Plan, and Market and Business Requirements which aim to justify the case for increasing night-time operations and therefore the need to draw up the policy.
7.1 The Policy
7.1.1 The actual policy is set out in paragraphs 18-23. Comments on these follow:
7.1.2 Paragraphs 18-20: Brief description of Quota Count (QC) systems in general.
7.1.3 Paragraph 21: Includes details of the proposed QC system for Manston:
Items a-c help define the QC system, but these are standard definitions.
7.1.4 Paragraph 22: Sets out the requirement for monthly quota monitoring reports which are to be submitted to Thanet District Council (TDC) and the Airport Consultative Committee. This is an appropriate arrangement.
7.1.5 Paragraph 23: Sets out that the airport will publish monthly noise data on its website to make it available to members of the public. Such transparency promotes good community relations, but it should be clarified what noise data will be published, and in what format. This should be agreed with TDC prior to acceptance of the policy.
7.2 Impact Assessment
7.2.1 The final paragraphs of the document are concerned with the impact assessment:
7.2.2 Paragraph 24: Describes the noise impact assessment prepared by Bickerdike Allen Partners, which BV has reviewed in section 4 of this report.
7.2.3 Paragraph 25: Draws attention to the consideration made in the noise impact assessment for the development of a sound insulation scheme, where properties contained within the 57 dB LAeq,8h night noise contour are to be eligible for sound insulation treatment to be fitted at the airports expense. It is on the basis of the actual annual noise contour rather than a forecast contour, so properties only become eligible after having already been exposed to such noise levels for up to 12 months. It would be recommended that the eligibility be based on forecast contours to enable residents to be protected prior to being exposed to the qualifying level of noise.
7.2.4 Paragraph 26: States that the MSE is committed to developing and agreeing such a scheme with TDC prior to any dwellings being encompassed by this contour. The wording does not categorically state that the airport will develop and agree such a scheme with TDC; it is suggested that the wording is changed to clearly state this. It is also suggested that such a scheme is developed and agreed at the time of agreeing the Night-time Flying Policy so that local residents are adequately protected from the adverse effects of night-time aircraft noise.
7.3 Suggested items also to be included in the policy
7.3.1 As stated in section 4.6 of this report, BV also suggests that the sound insulation scheme includes properties contained within the 90 dB(A) SEL noise contour of the noisiest aircraft forecast to regularly depart during the night-time period. This should be included in the Nighttime Flying Policy.
7.3.2 Also as stated in section 4.6 of this report, BV suggests that a limit is imposed on the area contained by the 48 dB LAeq,8h night-time noise contour to limit the potential noise impact on local residents due to night-time operations including those during the shoulder periods.
8.0 Conclusions
8.0.1 Significant numbers of people living in the vicinity of Manston Airport (MSE) are likely to experience noise impact due to forecast operations in 2018.
8.0.2 The Night Noise Assessment suggests that these impacts could be mitigated by means of a quota count system to limit aircraft movements during the core (6.5 hour) night period, and a sound insulation scheme which is proposed to be offered to residents whose dwellings are exposed to 57 dB LAeq,8h or more. It is hoped that this scheme would apply to habitable rooms including living rooms so that benefit is also afforded during the daytime.
8.0.3 Even with this in place, it is BVs view is that the predicted number of people likely to be exposed to significant levels of average night-time noise is not sufficiently justified by the number of passengers and freight activity that are forecast to benefit from the proposals.
8.0.4 BV considers that there is a good case for seeking a lower annual quota limit. A limit of just under 1570 would keep it within the range of likely total quota depending on the exact aircraft types used, and place it in line with the quota limit at London Heathrow. At the designated London airports, the quota limit is accompanied by a movement limit and it would be good practice to include a movement limit in any quota count regime established at MSE.
8.0.5 In order to reduce the likely noise impact on nearby residents, BV would recommend that bedrooms of dwellings exposed to 90 dB(A) SEL or more are also included in the proposed sound insulation scheme.
8.0.6 BV suggests an additional control to protect residents from noise impact during the whole night-time period, i.e. including the evening and morning shoulder-periods when the majority of night-flights are to occur. Imposing a suitable area limit for the 48 dB LAeq,8h night noise contour would be an appropriate means for controlling this.
8.0.7 It is BVs recommendation that the above points are considered for inclusion in the Night-time Flying Policy.
8.0.8 The conclusions on noise impact have been based upon computer noise modelling undertaken by BAP. BV has reviewed the input assumptions for this modelling and, using these, has undertaken their own independent noise modelling. The results of this have shown the contour modelling undertaken by BAP is accurate and representative of the input data provided.